The 2026 midterms are on track to be the most expensive advertising cycle in American history, and much of that money is chasing a familiar assumption: young voters live online, older voters read their mail. Campaign budgets have shifted toward connected TV and digital-first field operations accordingly.
A new survey of 1,000 U.S. adults, conducted for UPrinting, finds the assumption running in reverse. Gen Z respondents were the most likely of any generation to say a street full of one candidate's signs signals real momentum worth paying attention to, at 21% against 5% of Baby Boomers, with every generation in between falling in a clean staircase. The generation raised entirely online is the one still responding to paper.
The catch is where that attention lands. Roughly half of respondents say political displays in their community have made them hesitant to express their own views, and the hesitancy runs deepest in the places elections are actually decided. In states that have flipped between parties over the last five presidential cycles, visible political dominance was more likely to push residents into silence than to rally them.
Key findings
- 21% of Gen Z respondents say one candidate's signs dominating a neighborhood signals real local momentum, against 5% of Baby Boomers, with receptivity stepping down through every generation in between
- Repeated signs, mailers or bumper stickers made 22% of Gen Z respondents more favorable toward a candidate; 43% of Boomers say the materials had no effect on them at all
- Zero of the 83 Baby Boomer respondents said a bold, professional design would make them notice a local candidate's printed material
- Only 9% of Gen Z respondents feel completely comfortable expressing political views where they live, the lowest of any generation
- In states that have flipped between parties, 22% of residents say an opposing candidate dominating the neighborhood makes them less likely to display their own views, the highest of the three state groups, and just 17% say it makes them more determined to vote, the lowest
- A clear position on a local issue (28%) beats bold design (5%) by more than five to one as the feature most likely to earn attention on printed material
- Only 15% of respondents believe a sign-covered neighborhood reliably reflects how it will vote
The generational script has flipped
Campaign strategy treats print as a legacy medium for older voters. The survey found the opposite on every measure it tested.
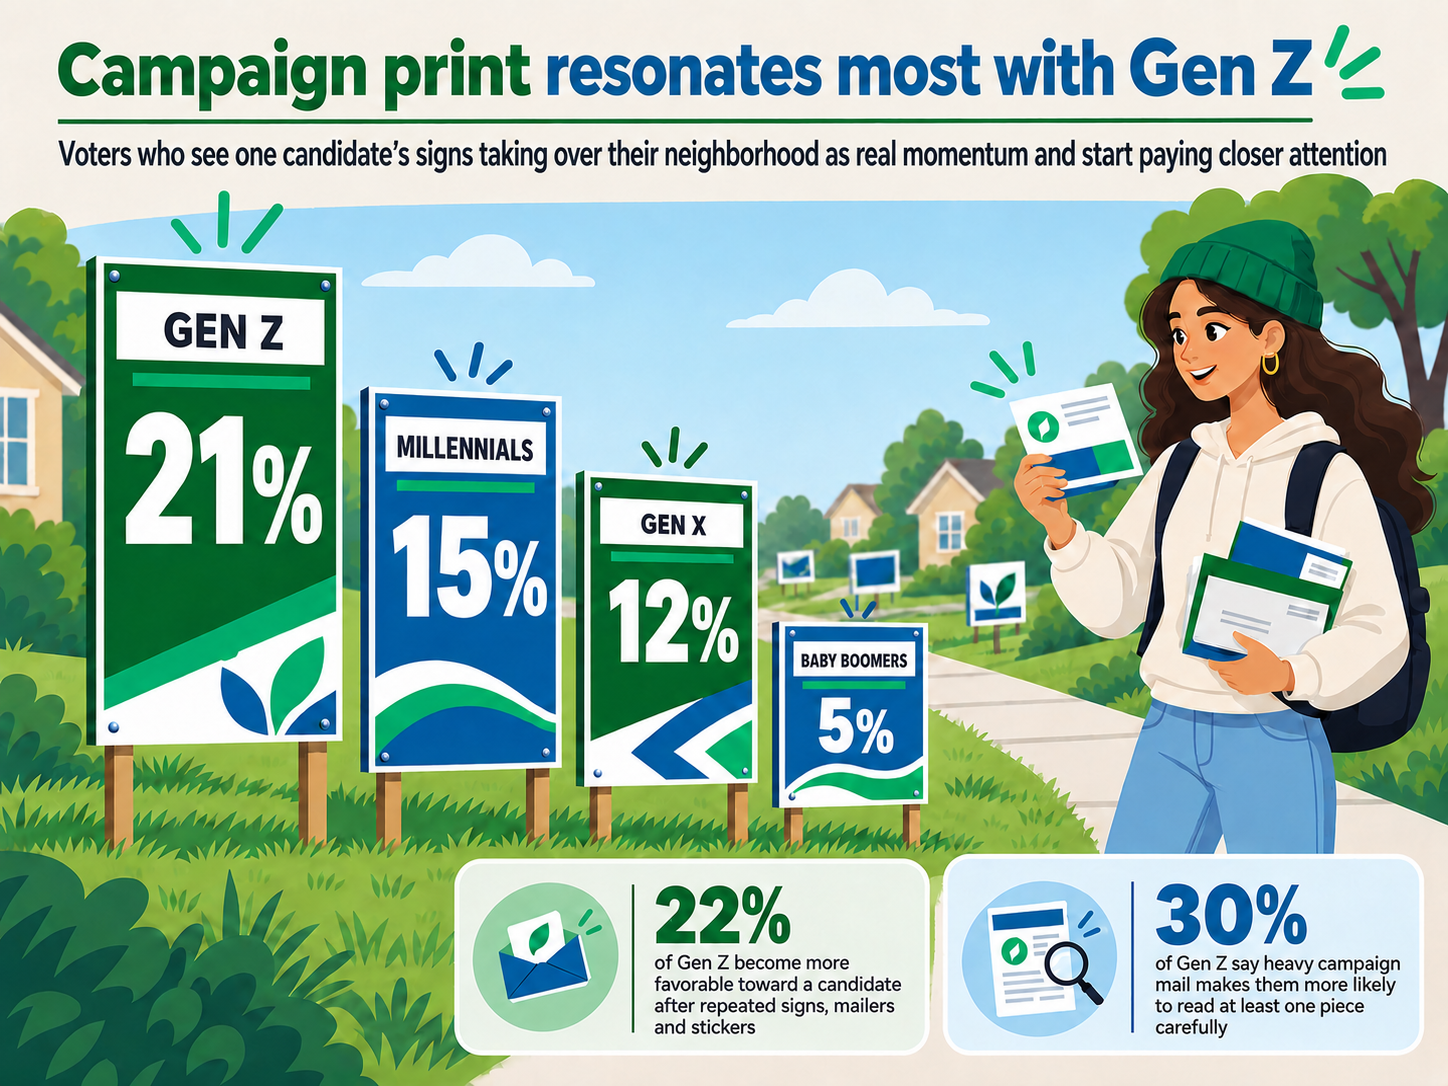
Asked what happens when one candidate's signs take over their neighborhood, 21% of Gen Z respondents said it signals real momentum and they start paying closer attention. The share falls at every older rung: 15% of Millennials, 12% of Gen X and 5% of Baby Boomers.
The same staircase appears on outcomes. Repeated signs, mailers and stickers made 22% of Gen Z respondents more favorable toward a candidate, while 43% of Boomers say the materials had no effect on them at all. And 30% of Gen Z said heavy mail volume makes them more likely to read at least one piece carefully, the highest of any age band.
The pattern extends up the ballot. 23% of Gen Z respondents said physical materials carry the most influence in statewide races, falling through 15% of Millennials and 8% of Gen X, with Boomers barely represented at all.
Field experiments have found lawn signs raise a candidate's vote share by modest but real margins, though that research never segmented the effect by age. This survey can't measure votes. What it shows is which generation still reports paying attention, and it is not the one the conventional wisdom predicts.
The most reliable voters have tuned everything out
The oldest voters turn out at higher rates than any other age group, and the Boomers in this study are the hardest audience to reach with anything.
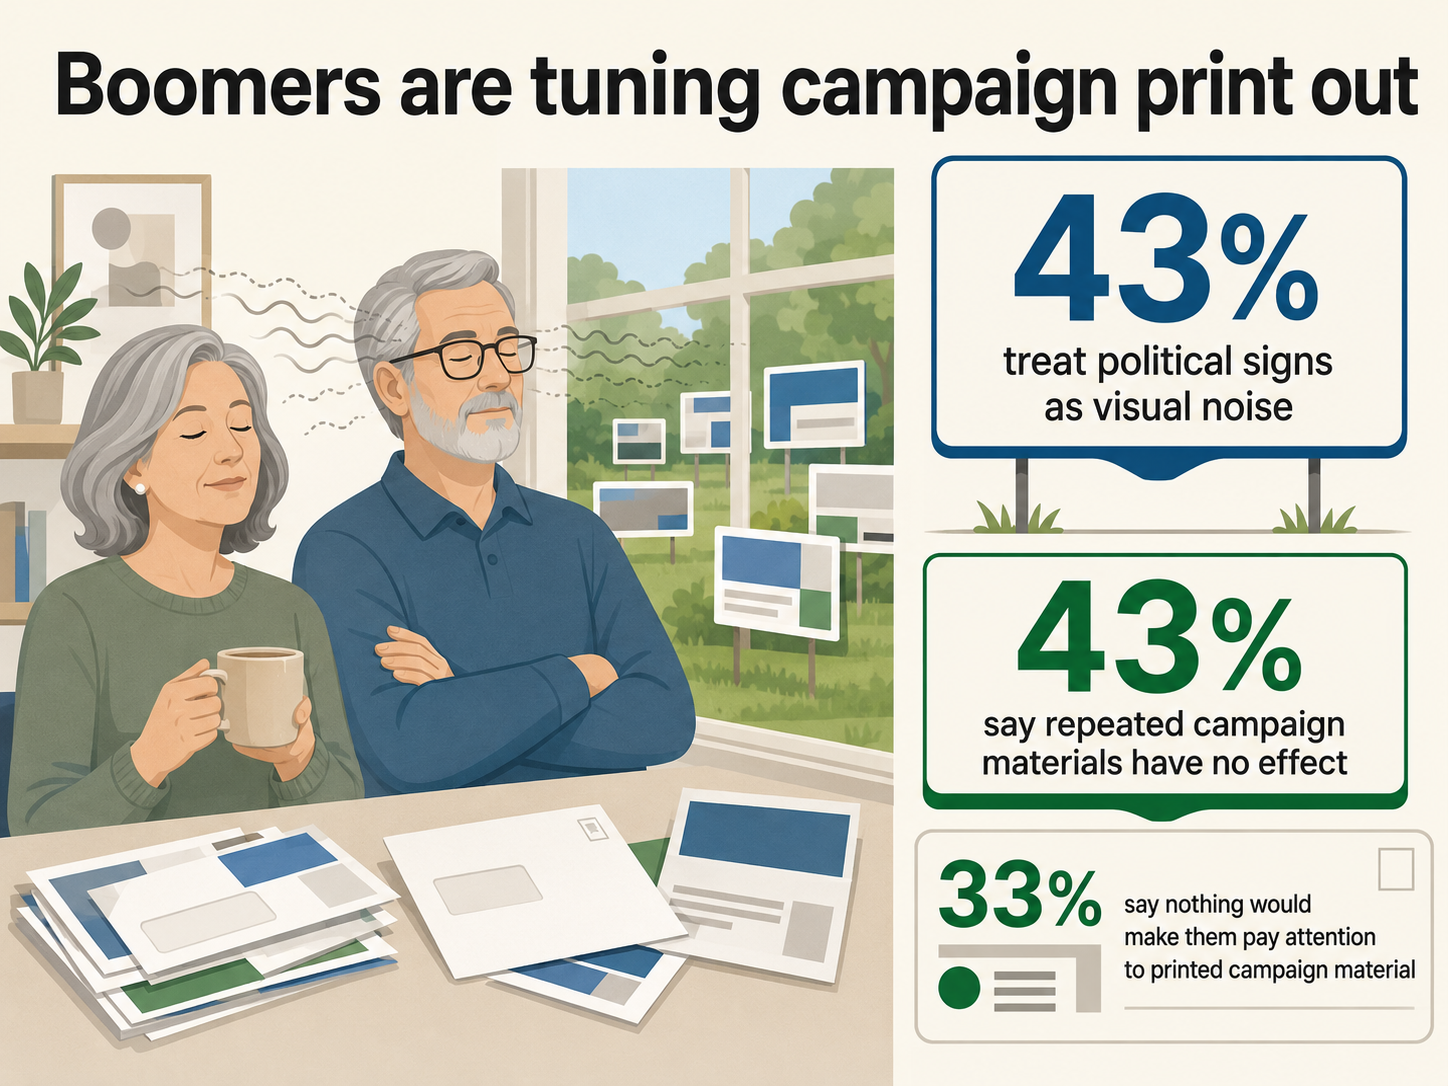
43% of Boomer respondents have learned to tune political signs out completely as visual noise, more than three times the Gen Z share. The same 43% say repeated campaign materials have had no effect on them whatsoever. On attack mail, nearly half of Boomers ignore it outright because negative campaigning turns them off. And 33% say nothing at all would make them pay attention to printed campaign material, the highest refusal rate of any age group.
The sharpest single cell in the dataset: asked which feature would most make them notice a local candidate's printed material, not one of the 83 Boomer respondents chose a bold, professional design. What Boomers do want is substance in a compact form. 31% chose a simple side-by-side comparison of the candidates, the feature they chose most and the highest share of any generation.
The most receptive generation is also the most hesitant
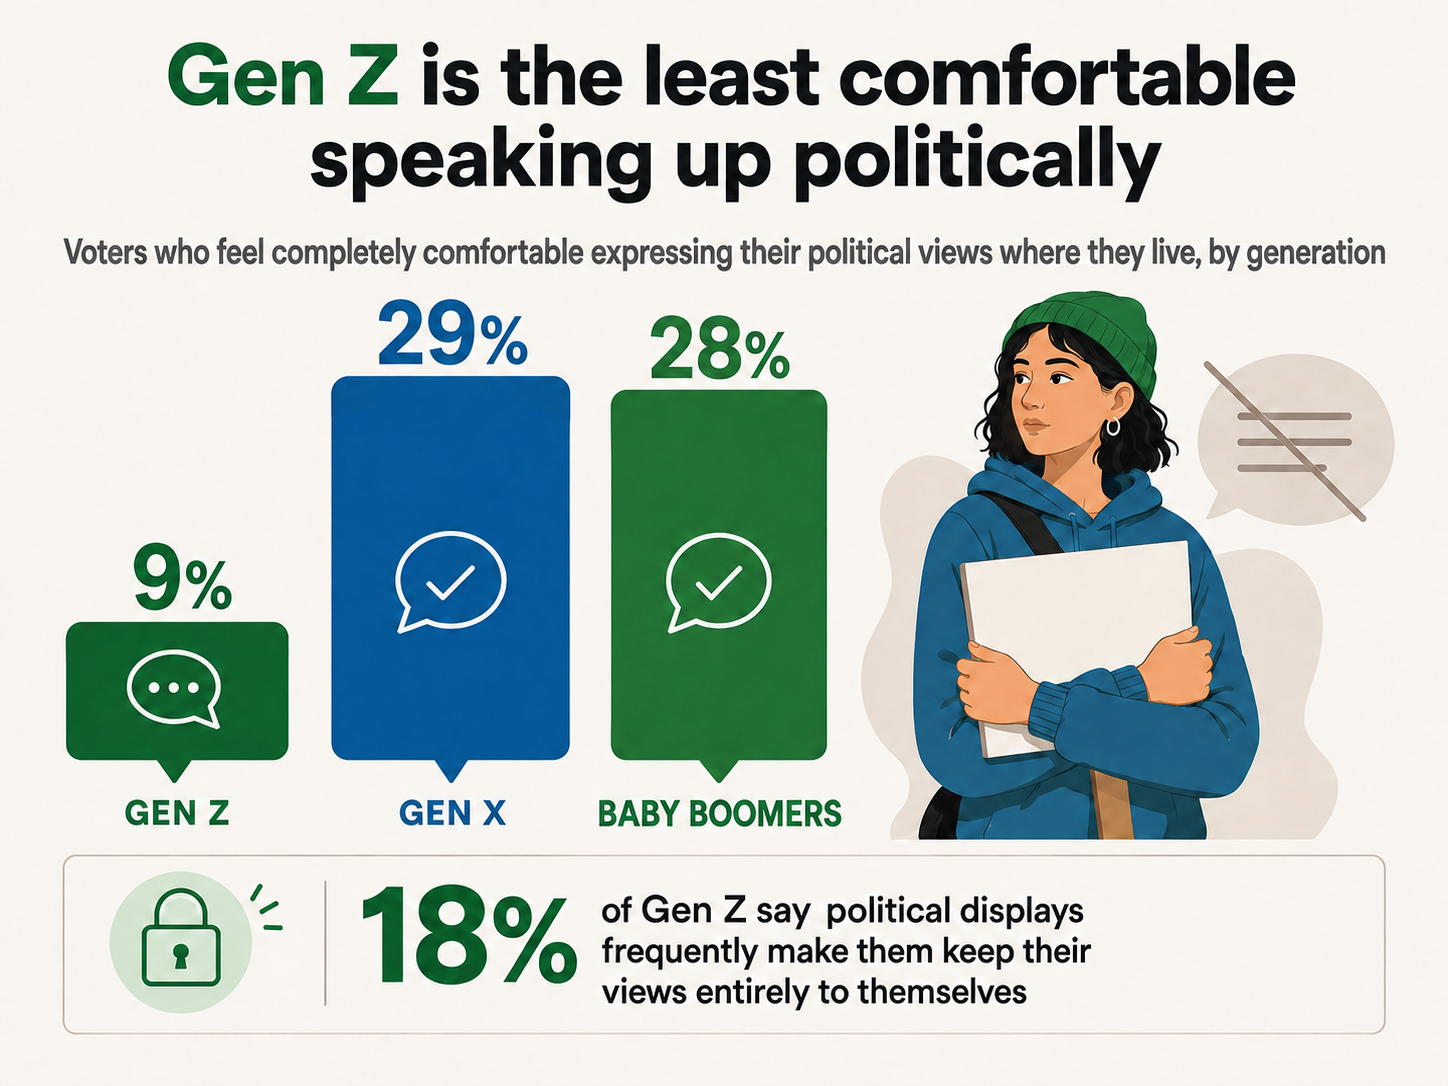
The generation most receptive to campaign material, by its own account, is also the most unsettled by it. Only 9% of Gen Z respondents feel completely comfortable expressing their political views where they live, against 29% of Gen X and 28% of Boomers. 18% of Gen Z respondents say displays around them frequently make them keep their views entirely to themselves. Among Boomers, the figure is in single digits.
Every fear measure in the study peaks with the youngest respondents. 27% have avoided displaying something because they feared vandalism or property damage, and 21% held back over the prospect of direct conflict with neighbors. Another 15% worried about consequences at work or in their social life. Among Boomers, that fear barely registers.
The emotional register runs hotter in both directions. Gen Z respondents were simultaneously the most likely to feel isolated in a politically one-sided neighborhood and the most likely to feel reassured by one. Nothing about political display reads as background noise to this generation.
The silence is thickest where elections are decided
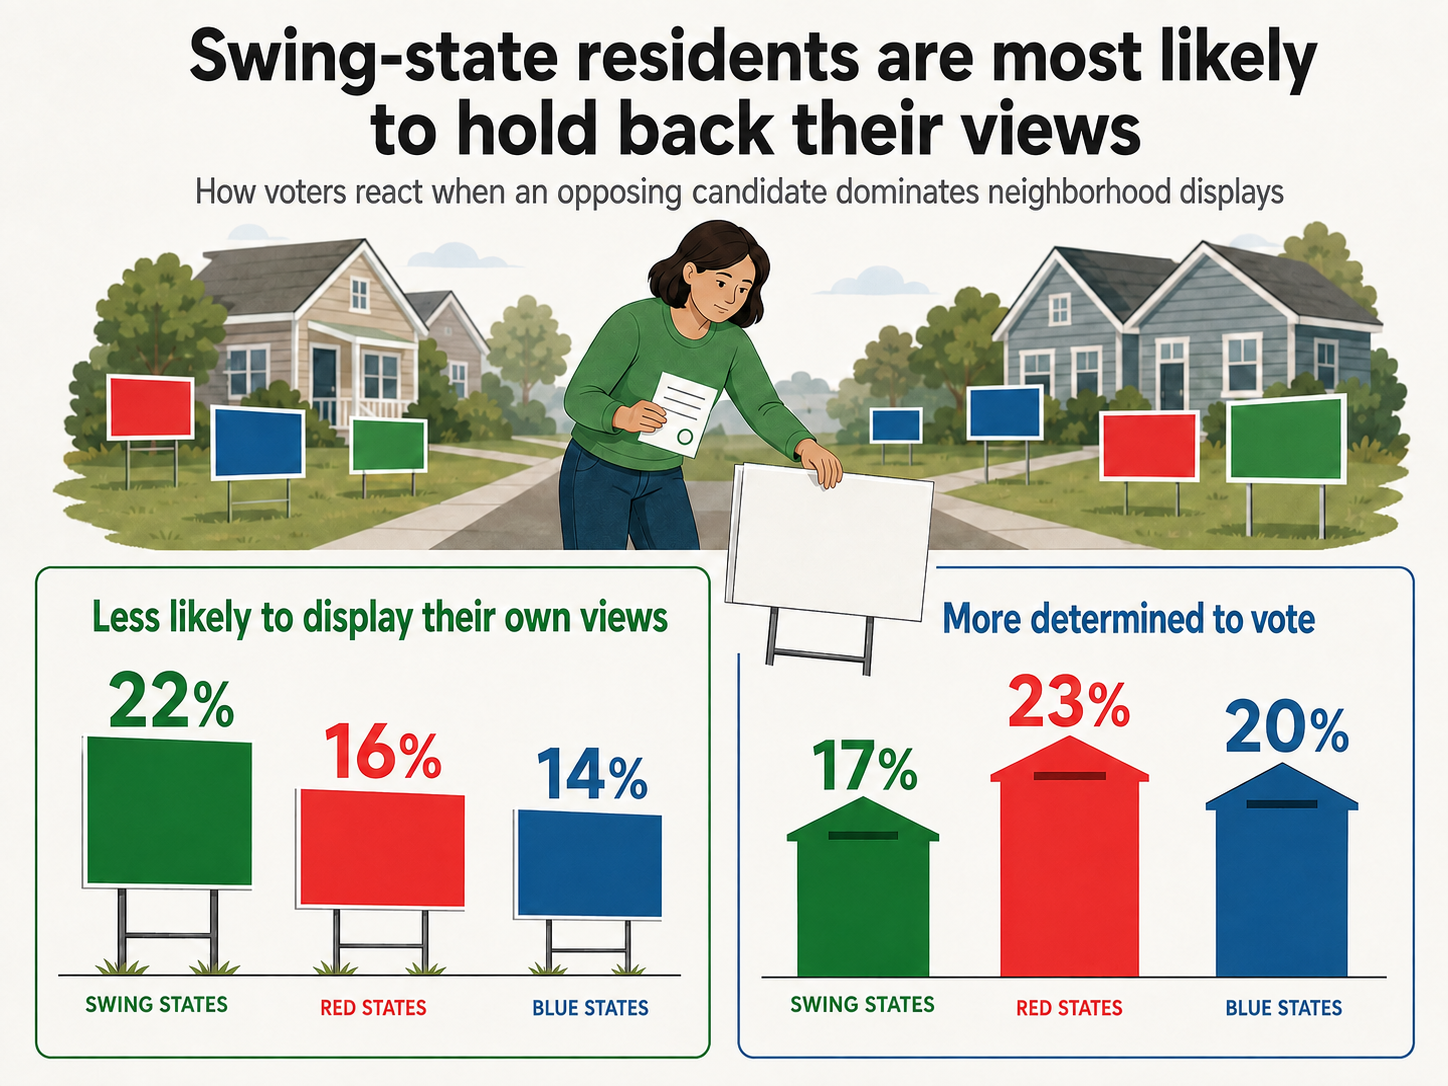
The survey grouped respondents by their state's presidential results across the last five election cycles. On most questions, a respondent's age, income and gender predicted their reaction to campaign material far better than the color of their state. The exception is what happens when one side visibly takes over.
In states that have flipped between parties, 22% of residents say an opposing candidate dominating their neighborhood makes them less likely to display their own views, against 16% in reliably red states and 14% in reliably blue ones. Those same residents were the least likely to say the takeover makes them more determined to vote: 17%, versus 23% in red states and 20% in blue states.
The hesitancy compounds. 53% of respondents in flipped states report some form of holding back because of political displays around them, the highest of the three groups, and 14% say displays frequently push them into total silence. Residents of flipped states were also the most likely to say campaigns can manufacture the appearance of momentum through sign placement, a suspicion that runs above both red and blue states.
Set that against the baseline: just 18% of respondents say they display their political views openly even when others around them disagree. Put together, the places that decide national elections are the places where visible political dominance suppresses expression rather than mobilizing it. The voters campaigns spend the most to reach are the ones most likely to respond by going quiet.
The attention gap runs through gender and income
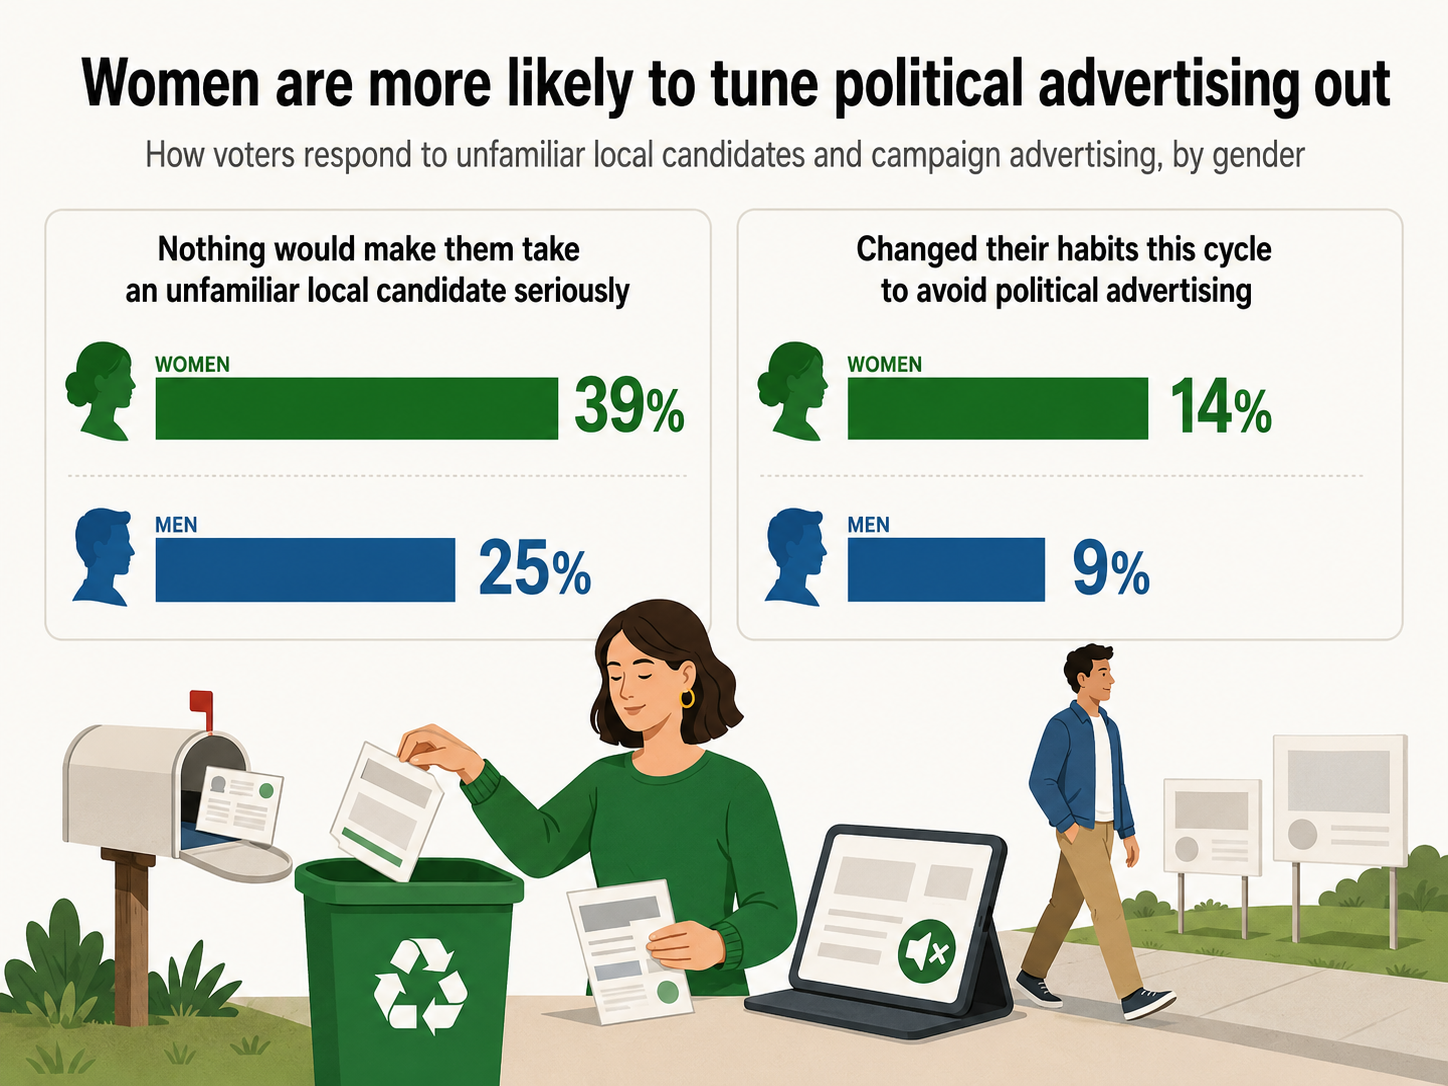
Two demographic splits cut across every reachability question in the survey.
The first is gender. Asked what would make them take an unfamiliar local candidate seriously, 39% of women said none of the options would, against 25% of men, the widest gender gap anywhere in the study. Women were more likely to tune signs out entirely and to say mail volume makes no difference either way.
They are also opting out more actively: 14% have deliberately changed their habits this cycle specifically to avoid political advertising, against 9% of men. Women made up 61% of this sample and a majority of the actual electorate. A format strategy tuned to what works on men is optimizing for the smaller share.
The second is income, and it runs against the suburban-lawn stereotype. 16% of respondents earning under $25,000 named yard signs as the outreach most likely to earn their attention in a close local race, against 5% of those earning $100,000 to $249,999, with the share falling at every income rung in between.
The households most associated with lawn signage are the least moved by it. At the same time, the lowest earners were the most likely to have restructured their habits to avoid political advertising altogether, at 21%, so the medium's best audience is also the one working hardest to escape it.
What actually earns the attention
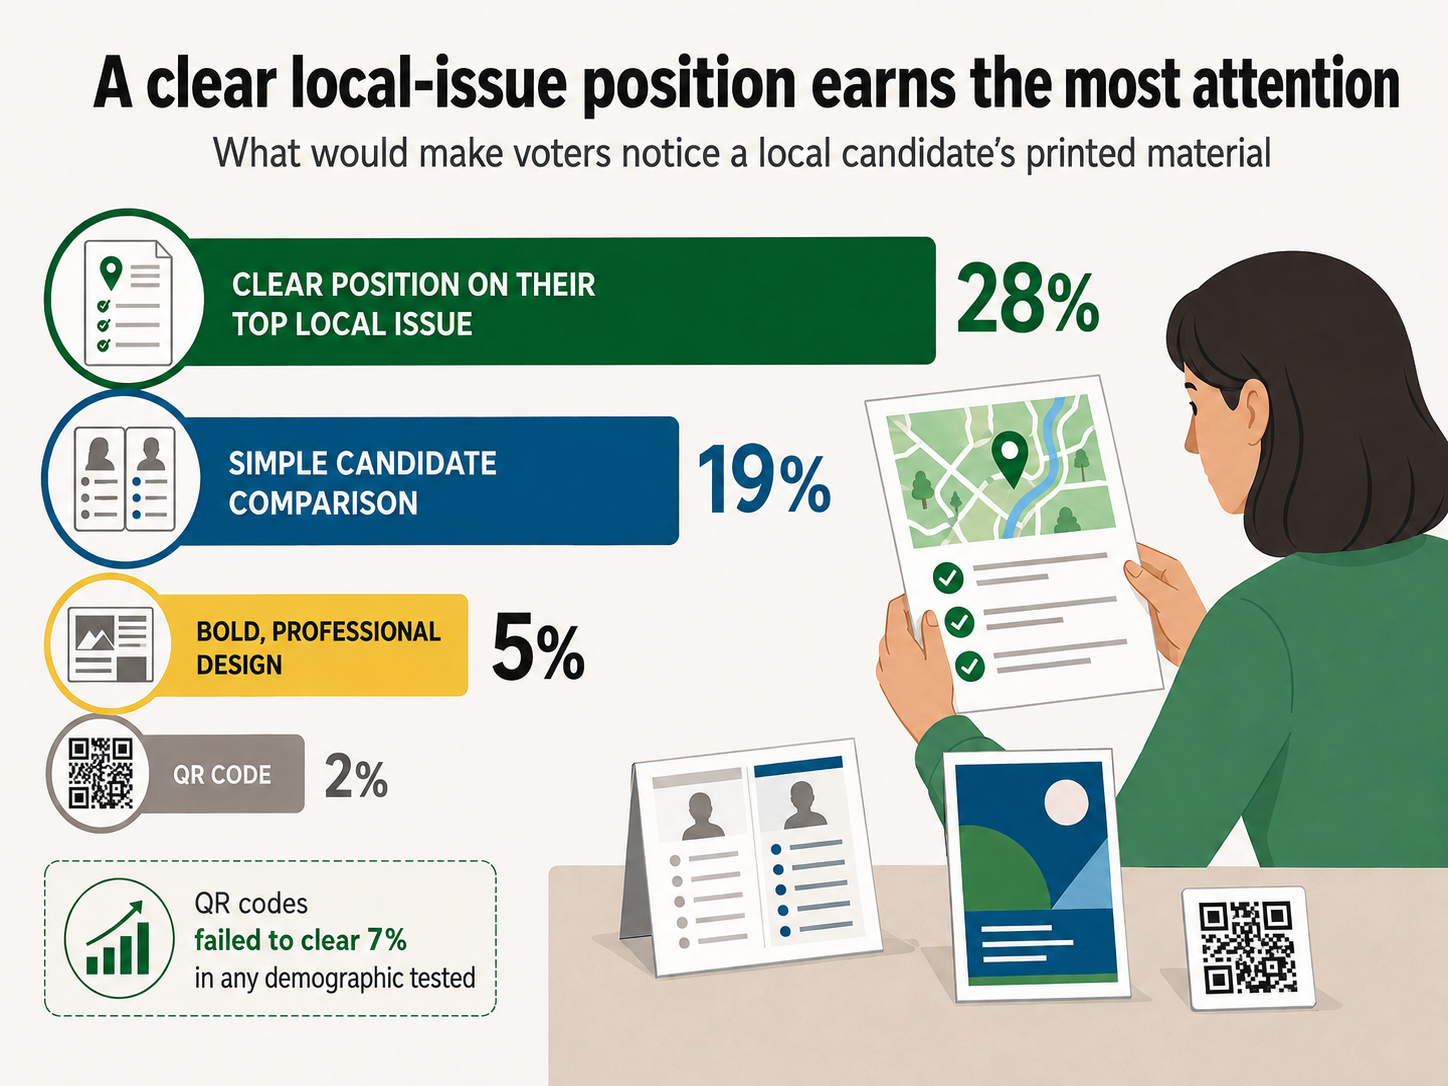
Across the full sample, one answer dominated the question of what would make a voter notice a local candidate's printed material: a clear position on the local issue they care about most, at 28%. A simple comparison between candidates followed at 19%. A bold, professional design drew 5% and a QR code just 2%, the lowest-scoring option anywhere in the survey. The QR code failed to clear 7% in any demographic column tested.
The bandwagon theory fares no better. Only 15% of respondents believe a neighborhood dominated by one candidate's signs reliably reflects how it will vote. The skepticism holds in every segment large enough to cite; the most credulous of those groups still lands under one in four.
The message for anyone printing campaign material is direct. Voters are not counting signs and they are not admiring layouts. They are reading for a position on the thing they already care about, and everything else on the page is decoration.
Summary
The conventional map of campaign outreach has print flowing to the old and pixels flowing to the young, and this survey suggests both arrows point the wrong way. The generation most responsive to physical campaign material is the youngest one, the most reliable voting bloc has stopped looking and the households most moved by a yard sign are the ones least likely to own the lawn it sits on.
Underneath the media strategy question sits a quieter civic one. Half of respondents have hesitated to say what they think where they live, and the hesitation is heaviest in the states that swing national elections. Campaign displays are doing something more complicated than advertising: they are shaping who feels safe speaking at all. The voters worth listening to in 2026 may be the ones the signs have gone silent around, and the campaigns that reach them will be the ones that put a local answer, rather than a louder design, on the page.
Methodology
To understand how U.S. adults respond to political signage and campaign advertising, we surveyed 1,000 adults across the country in August 2026 via Pollfish. Participants answered questions about how yard signs, mailers and other campaign materials affect their attention, their opinion of candidates and their willingness to express their own political views. Responses were analyzed by demographic groups to identify trends and disparities. Results are unweighted; women made up 61% of respondents and the sample skews younger than the U.S. adult population. Percentages are shares of each subgroup. For state-level comparisons, respondents were grouped by their state's presidential results across the 2008 through 2024 elections; respondents were never asked their political affiliation, and no finding describes how anyone voted.
Fair Use Policy
Users are welcome to utilize the insights and findings from this study for noncommercial purposes, such as academic research, educational presentations, and personal reference. When referencing or citing this article, please ensure proper attribution to maintain the integrity of the research. Direct linking to this article is permissible, and access to the original source of information is encouraged.
For commercial use or publication purposes, including but not limited to media outlets, websites, and promotional materials, please contact the authors for permission and licensing details. We appreciate your respect for intellectual property rights and adherence to ethical citation practices. Thank you for your interest in our research.